Trends in Local Air Quality (LAQ)
As part of the CAEP/13 (2025) update to the ICAO Global Environmental Trends, a range of scenarios were developed for the assessment of future aircraft emissions affecting LAQ, i.e. that occur below 3,000 feet above ground level; namely NOx and total (volatile and non-volatile) particulate matter (PM).
The LAQ portion of the trends assessment evaluated potential contributions of operational and technology improvements to reducing projected emissions of NOx and potential contributions of operational improvements to reducing projected emissions of the particulate matter (PM). The results are based on the CAEP/13 2018 to 2070 post COVID traffic and fleet forecast, representing NOx, non-volatile PM and Total PM emissions below 3 000 feet. NOx technology improvement scenarios leverage the latest Independent Experts work.
NOx emissions below 3 000 feet from international aviation are shown in Figure 1. In 2050, technology and operational improvements could provide reductions of up to 0.14 Mt in NOx emissions for international aviation. In 2070, technology and operational improvements could provide reductions of up to 0.30 Mt in NOx emissions for international aviation.
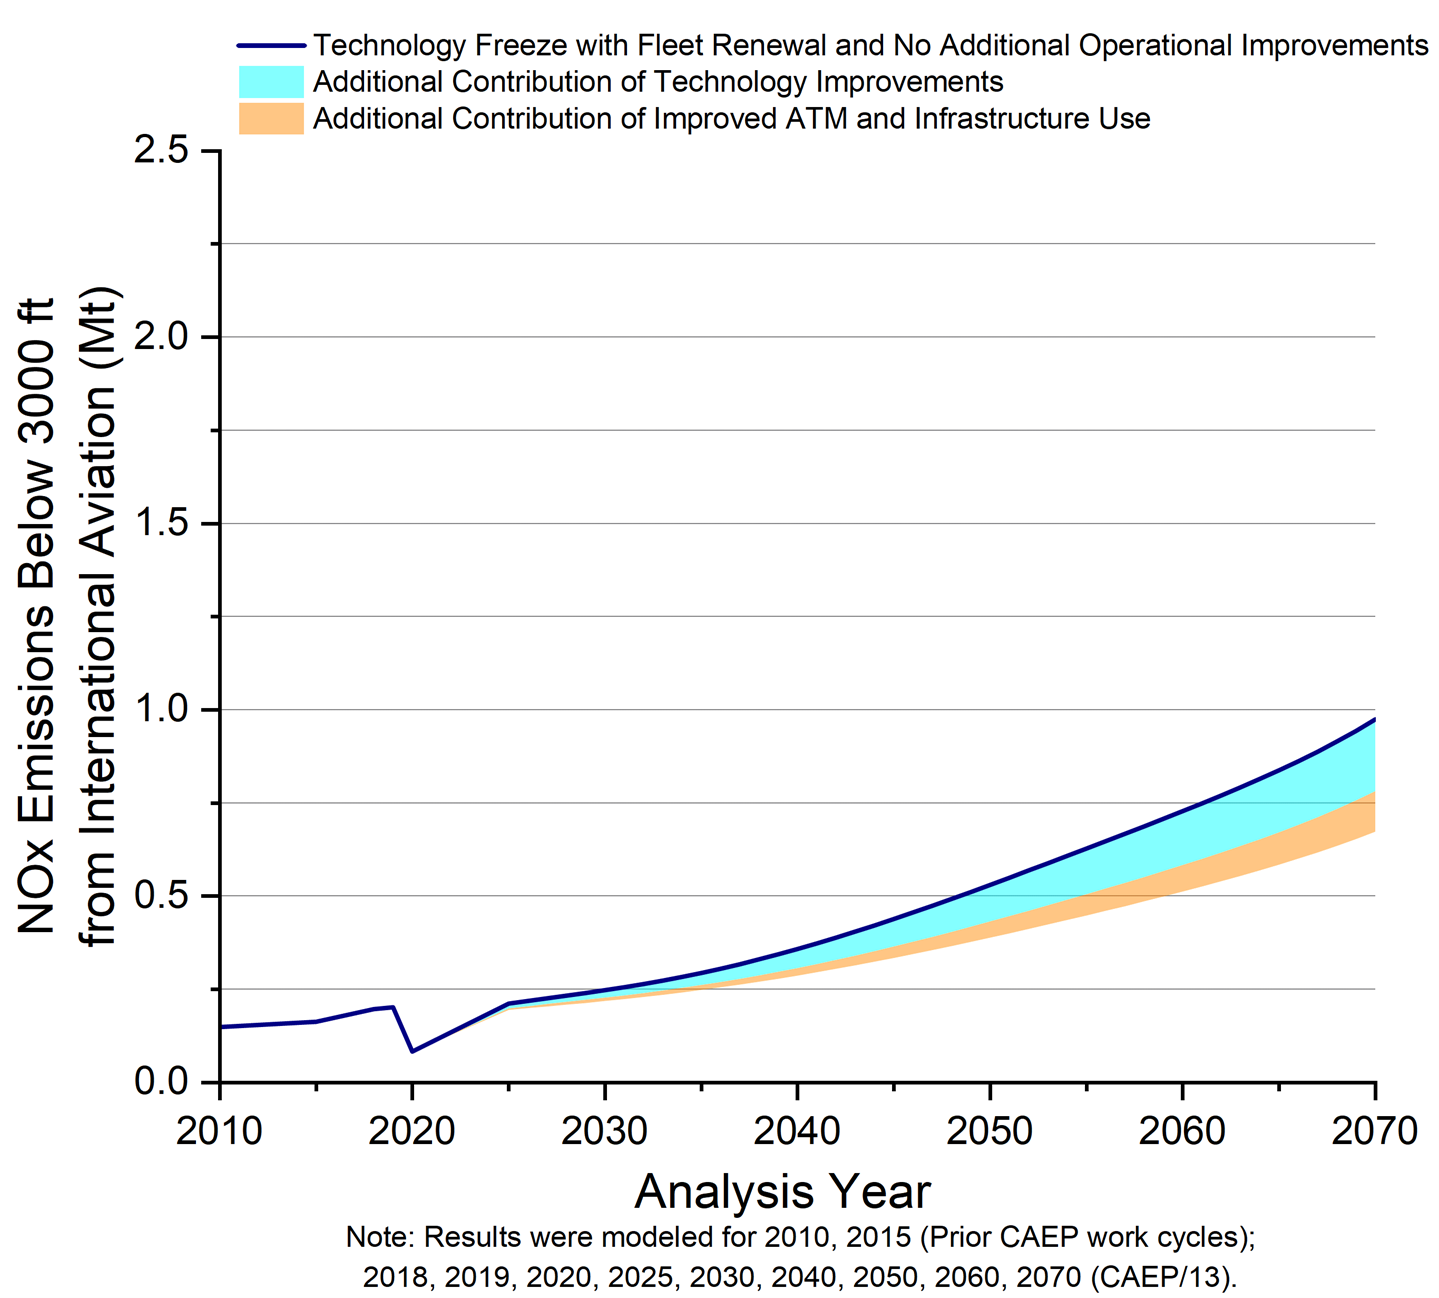
Figure 1. NOx Emissions below 3000 ft from International Aviation, 2010 to 2070.
nvPM emissions below 3 000 feet from international aviation are shown in Figure 2. For nvPM, we see a large drop from the base year 2018 going into 2019. This is due to a few high nvPM producing engines in the 2018 baseline, and them dropping out of the fleet in 2019 due to retirement and being replaced by engines having relatively lower nvPM.
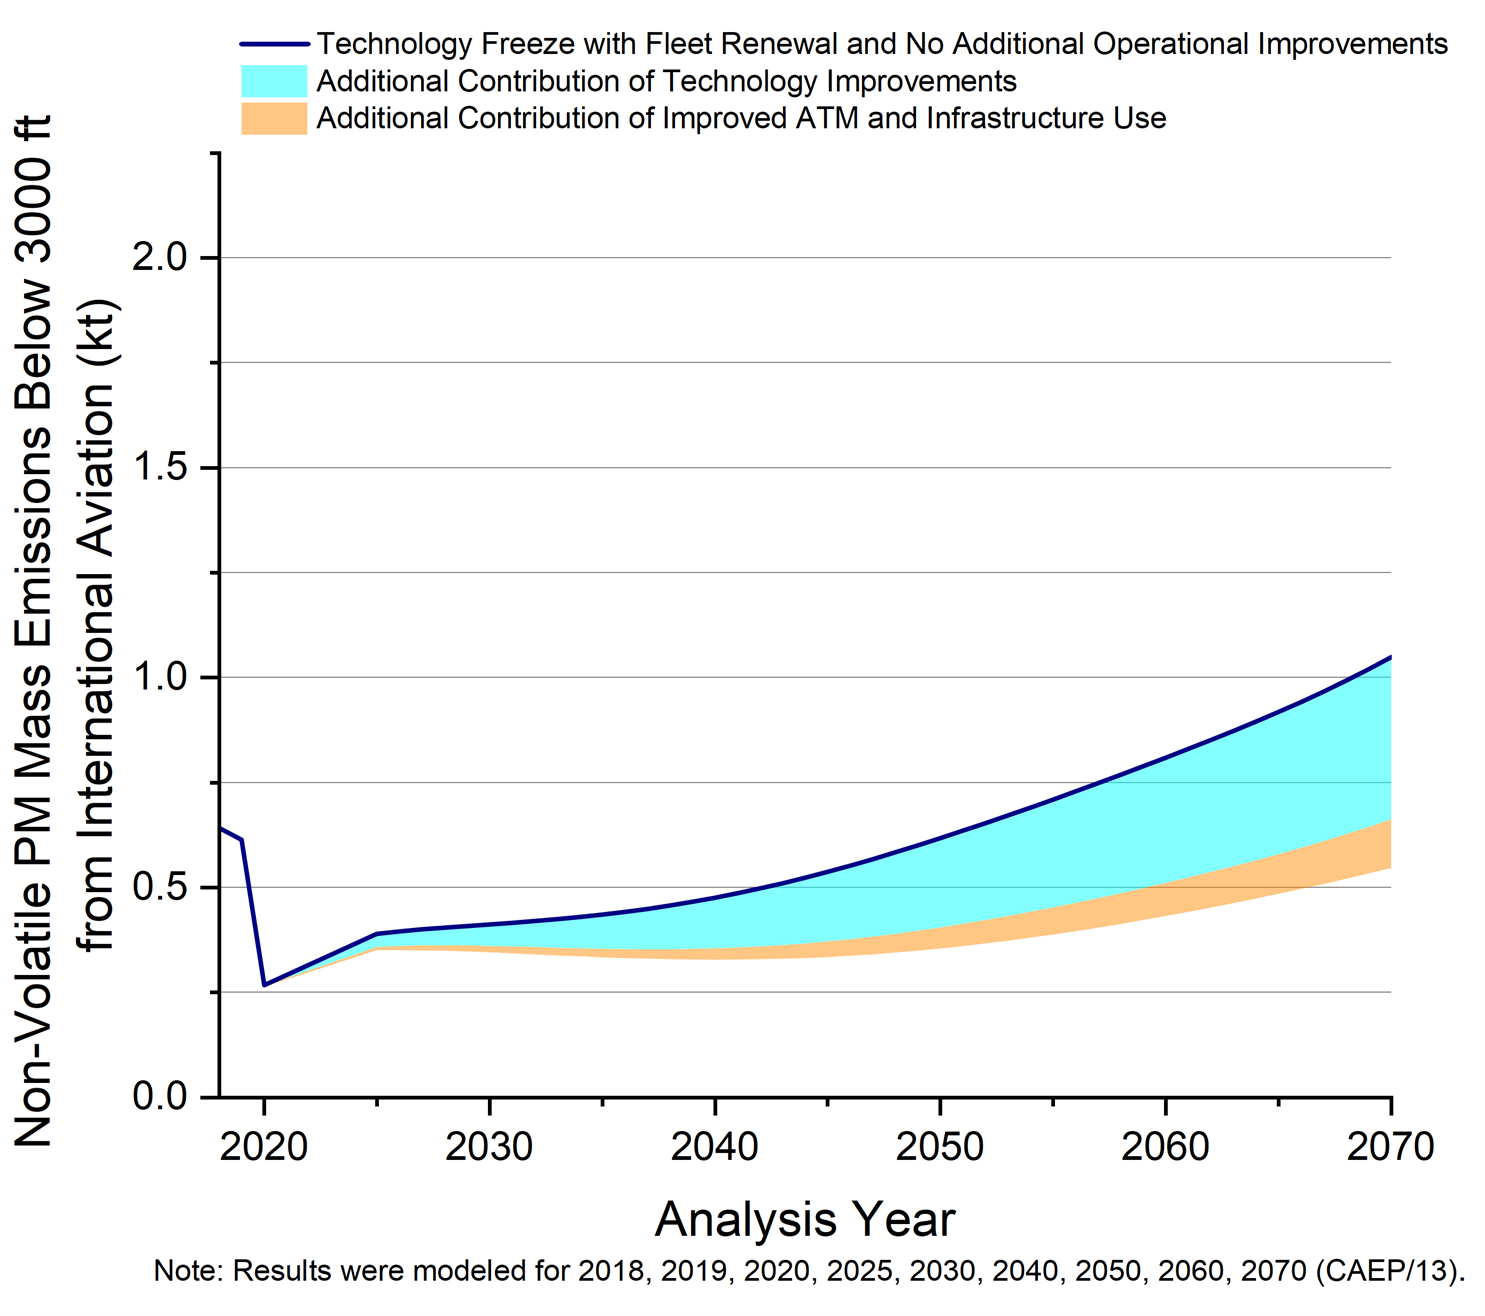
Figure 2. nvPM Emissions below 3000 ft from International Aviation, 2018 to 2070.
Total (volatile and non-volatile) PM emissions below 3 000 feet from international aviation are shown in Figure 3. In 2050, technology and operational improvements could provide reductions of up to 0.92 kt in total PM emissions for international aviation. In 2070, technology and operational improvements could provide reductions of up to 1.83 kt in total PM emissions for international aviation.
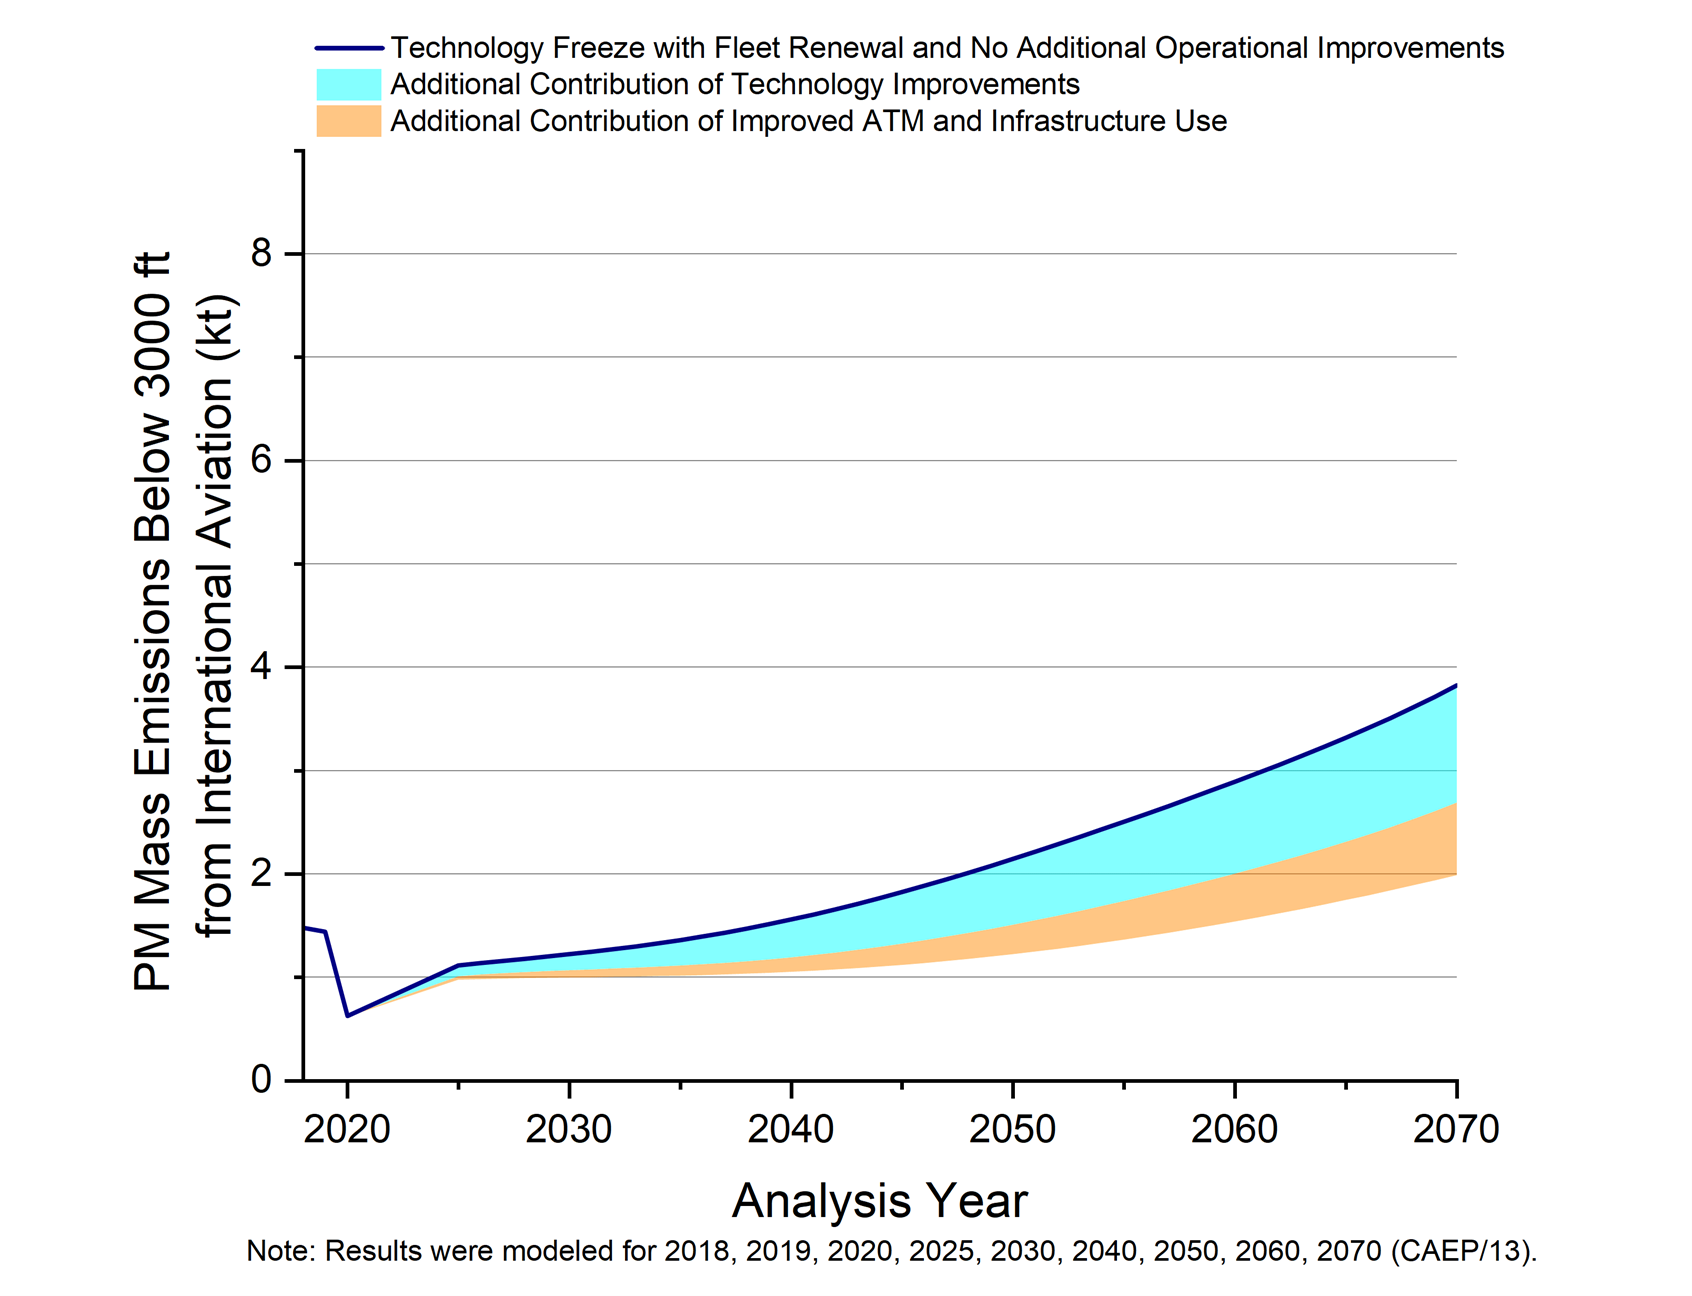
Figure 3. Total PM Emissions below 3000 ft from International Aviation, 2018 to 2070.