Global trends in Aircraft Noise
As part of the CAEP/13 (2025) update to the ICAO Global Environmental Trends, four scenarios were developed for the noise trends assessment, resulting in the total contour area and population inside the yearly average day-night level (DNL) contours (55, 60, and 65 dB) for 320 global airports, representing approximately 80% of the global traffic.
Population counts for airports in the US, Europe, and Brazil used the latest available local census data. For all other airports, the NASA Gridded Population of the World, version 4 (GPW v4) was used.
Scenario 1 (CAEP/13 Baseline) assumes no further aircraft technology or operational improvements after 2018. Scenario 2 includes noise technology improvements of 0.1 EPNdB per annum for all aircraft entering the fleet from 2019 to 2070. Scenario 3 was meant to capture a COVID-19 delay, with no noise technology improvements for aircraft entering the fleet from 2019 to 2023, and technology improvements of 0.2 EPNdB per annum for all aircraft entering the fleet from 2024 to 2070. Scenario 4 includes noise technology improvements of 0.2 EPNdB per annum for all aircraft entering the fleet from 2019 to 2070. For Scenarios 2, 3, and 4, an additional moderate operational improvement of 2% is applied for population inside DNL 55, 60, and 65 contours.
Figure 1 provides results for the total global 55 DNL contour area (i.e., for 320 airports) for 2018 (base year), 2019, 2020, 2025 (scenario 1 only) and 2030, 2040, 2050, 2060 and 2070 for the four modelling scenarios. Historical data modelled in the CAEP/11 work cycle is also shown for 2015. The 2018 technology freeze value is 16 657 square km. This value decreases to 10 306 square km in 2020 due to COVID-19 pandemic and increases to 14 164 square km by 2025. In 2070 the technology freeze (scenario 1) total global contour area is 32 887 square km and decreases to 22 240 square km with low technology improvements (scenario 2), to 15 723 square km with moderate technology improvements (scenario 3), and to 11 363 square km with the advanced technology improvements (scenario 4).
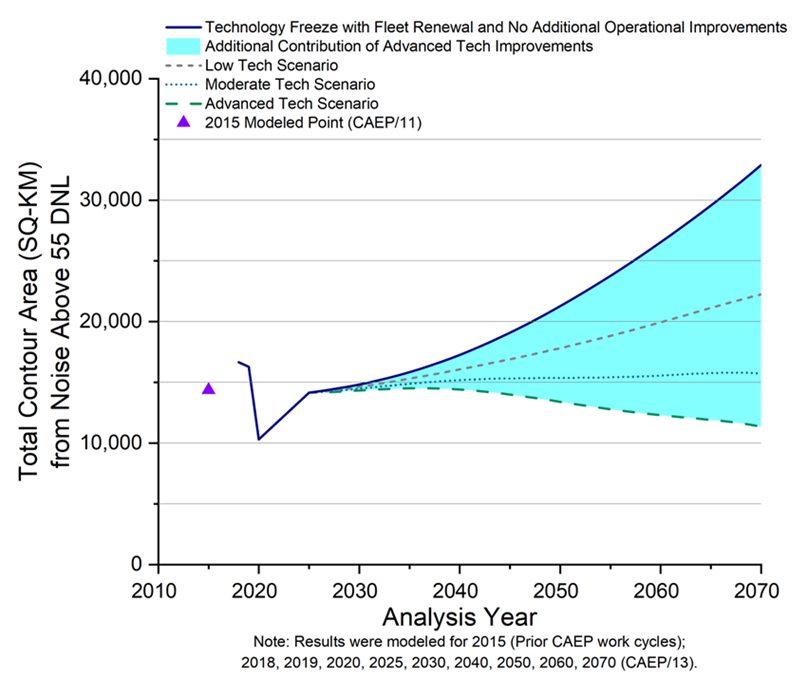
Figure 1. Global Contour Area From Noise above 55 DNL, 2015 - 2070.
Figure 2 provides results for the total global (i.e., for 320 airports) population exposed to aircraft noise above 55 DNL for 2018 (base year), 2019, 2020, 2025 (scenario 1 only) and 2030, 2040, 2050, 2060 and 2070 for the four scenarios. Historical data modelled in the CAEP/11 work cycle is also shown for 2015. The 2018 baseline value is 35.97 million people. In 2020, the population decreases to 20.5 million due to the COVID-19 pandemic and increases to 29.9 million by 2025. In 2070, the technology freeze (scenario 1) total population exposed is 78.29 million and decreases to 54.54 million people with low technology and operational improvement scenario (scenario 2), to 38.6 million with moderate technology and operational improvement scenario (scenario 3), and to 27.25 million people with the advanced technology and operational improvement scenario (scenario 4).
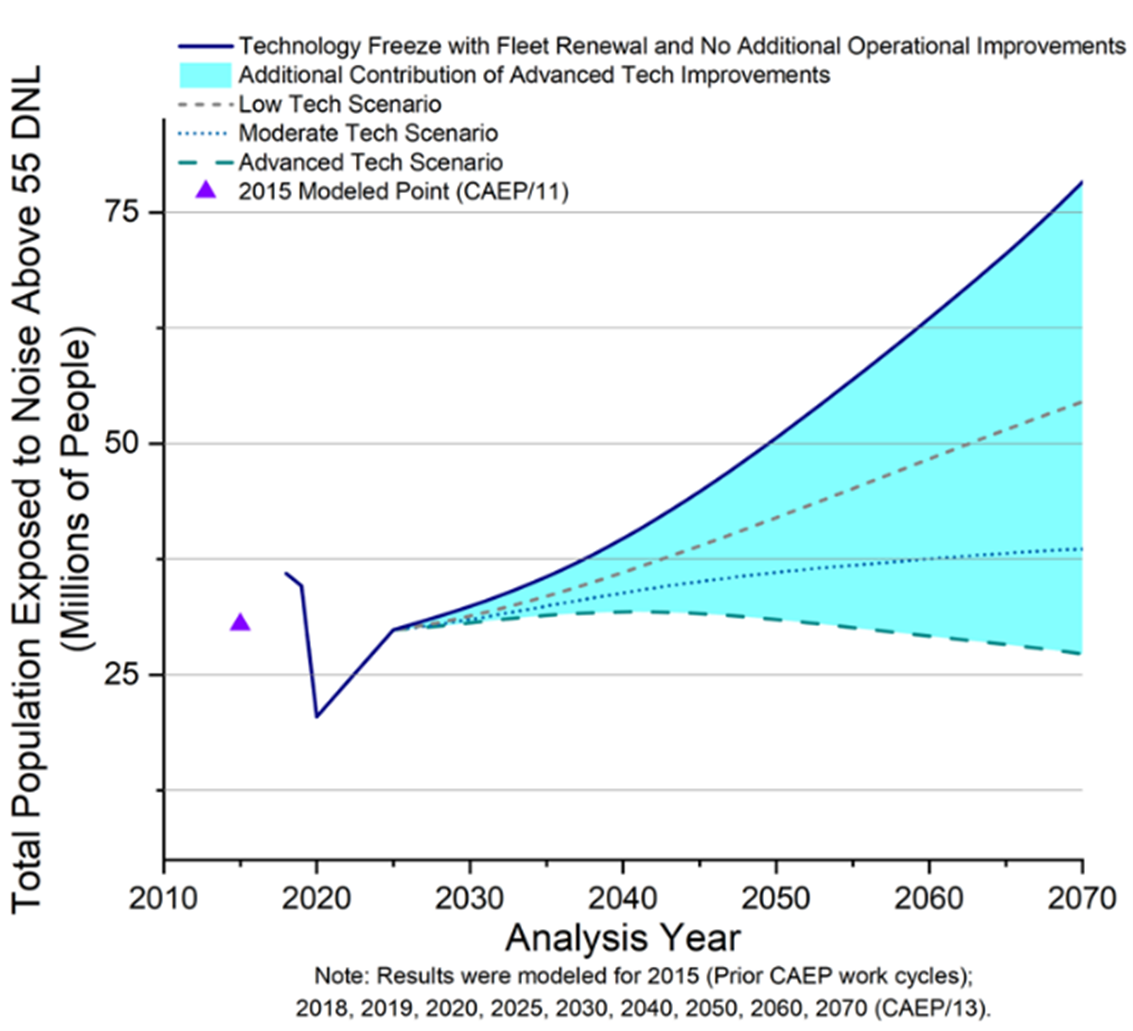
Figure 2. Global Population Exposed to Noise above 55 DNL, 2015 - 2070.