عالم النقل الجوي في عام 2024
ستُنشر الترجمات حال توفرها
This year the level of reported data by ICAO Member States presented in the Annual Report of the Council achieved the exceptional level of 99.0 per cent of global coverage. It is important to note that ICAO official statistics present the highest level of reporting coverage compared to any other source of global aviation data. It shows once again the trust the Member States have in official reporting and their confidence in ICAO data.
E-mail Contact: cads [at] icao.int (cads[at]icao[dot]int)
According to ICAO’s preliminary compilation of annual global statistics, the total number of passengers carried on scheduled services increased to 4.7 billion in 2024, which is 7.9 per cent higher than the previous year, while with the number of departures increasing to 37.4 million in 2024, a 5.1 per cent increase. Detailed air transport statistics appear on the Presentation of 2024 Air Transport Statistical Results page.
Note.—The sum of the individual regions may not match the totals due to rounding.
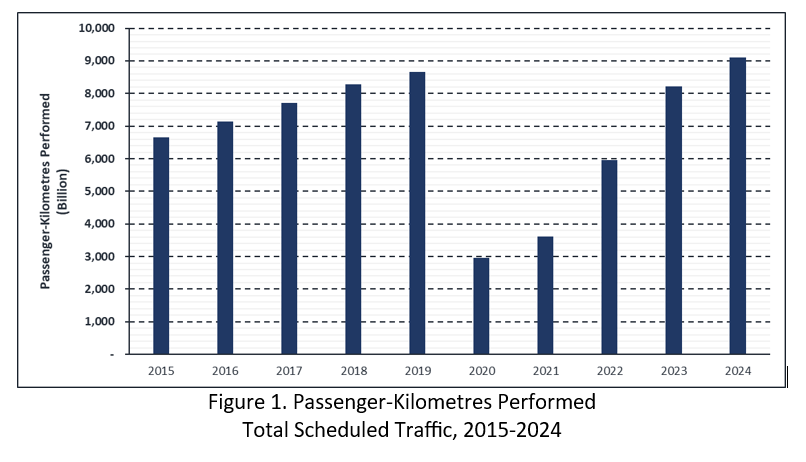
Passenger traffic (total scheduled revenue passenger-kilometres performed (RPKs))
Total increase: 10.6 per cent, equating to 9,098 billion RPKs
Change by region –
Europe: 26.2 per cent of world traffic, posting an increase of 8.9 per cent
Africa: 2.2 per cent of world traffic, posting an increase of 10.0 per cent
Middle East: 9.8 per cent of world traffic, posting an increase of 9.8 per cent
Asia and Pacific : 33.7 per cent of world traffic, posting an increase of 16.7 per cent
North America: 22.6 per cent of world traffic, posting an increase of 4.9 per cent
Latin America and Caribbean: 5.4 per cent of world traffic, posting an increase of 9.2 per cent
International scheduled passenger traffic
Total increase: 13.8 per cent in RPKs, equating to 5,575 billion RPK
Change by region –
Europe: 36.8per cent of total RPK, posting an increase of 9.5 per cent
Africa: 3.2 per cent of total RPK, posting an increase of 13.8per cent
Middle East: 15.3 per cent of total RPK, posting an increase of 9.9 per cent
Asia and Pacific: 27.4 per cent of total RPK, posting an increase of 28.9 per cent
North America: 12.8 per cent of total RPK, posting an increase of 7.5 per cent
Latin America and Caribbean: 4.6 per cent of total RPK, posting an increase of 15.8 per cent
Domestic scheduled passenger traffic
Total increase: 5.0 per cent in RPKs
Change by region –
Europe: 9.5 per cent of total RPK, posting an increase of 5.8 per cent
Africa: 0.6 per cent of total RPK, posting a decrease of 13.4 per cent
Middle East: 1.1 per cent of total RPK, posting an increase of 7.9 per cent
Asia and Pacific: 43.8 per cent of total RPK, posting an increase of 6.7 per cent
North America: 38.3 per cent of total RPK, posting an increase of 3.6 per cent
Latin America and Caribbean: 6.7 per cent of total RPK, posting an increase of 2.8 per cent
Available seat-kilometres (ASK) capacity
Total increase: 9.1 per cent, passenger load factor of 83.2 per cent
Global share and load factor:
Europe: 25.6 per cent of total ASK, with passenger load factor of 85.4 per cent
Africa: 2.6 per cent of total ASK, with passenger load factor of 71.1 per cent
Middle East: 10.0 per cent of total ASK, with passenger load factor of 81.2 per cent
Asia and Pacific: 34.0 per cent of total ASK, with passenger load factor of 82.6 per cent
North America: 22.4 per cent of total ASK, with passenger load factor of 84.1 per cent
Latin America and Caribbean: 5.5 per cent of total ASK, with passenger load factor of 82.8 per cent
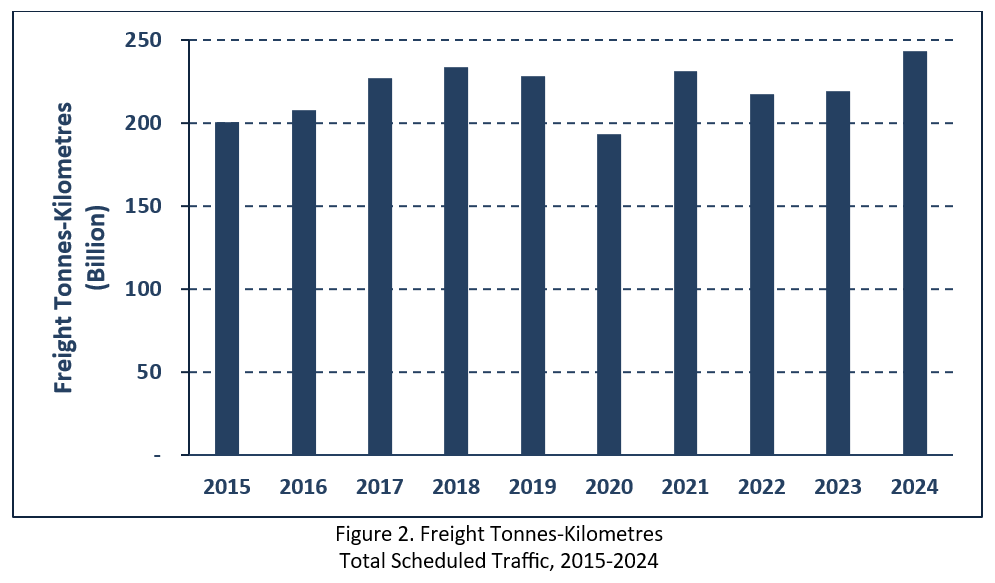
Freight traffic
Total millions of tonnes carried: 60.8 million
Increase of scheduled total freight traffic, expressed in terms of scheduled total freight tonne-kilometres performed (FTKs): 11.0 per cent
Increase of total scheduled international freight traffic, expressed in terms of FTKs performed: 12.0 per cent
And by region –
Europe: 26.0 per cent of total FTKs performed, posting an increase of 11.5 per cent
Africa: 2.6 per cent of total FTKs performed, posting an increase of 3.6 per cent
Middle East: 16.5 per cent of total FTKs performed, posting an increase of 12.4 per cent
Asia and Pacific: 37.6 per cent of total FTKs performed, posting an increase of 13.7 per cent
North America: 14.1 per cent of total FTKs performed, posting an increase of 9.0 per cent
Latin America and Caribbean: 3.2 per cent of total FTKs performed, posting an increase of 13.7 per cent
Scheduled international freight capacity in 2024, expressed in available freight tonne-kilometres, was approximately 416 billion, an increase of 7.9 per cent compared to 2023. The scheduled international freight load factor in 2024 increased to 51.8 per cent.
Operating profit of scheduled airlines of Member States
Estimated at about a positive 6.4 per cent of operating revenues, operating profit is expected to be around USD 61.8 billion in 2024 based on operating revenues of USD 958.4 billion.
A detailed variance analysis of changes in operating profits appears in the Presentation of 2024 Air Transport Statistical Results, Table 9.
Long-term air traffic forecasts
The long-term traffic forecast scenarios developed by the Secretariat and the Multi-Disciplinary Working Group on Long-term Traffic Forecasts are based on three scenarios (low, mid, and high). Under the mid scenario, passenger traffic, expressed in revenue passenger-kilometres, is projected to grow at an average annual rate of 4.1 per cent over the next 20 years.
Aircraft
The world’s major manufacturers delivered 1,114 new commercial aircraft in 2024 and recorded 1,380 new aircraft net orders. Book-to-bill ratios for two of the largest aircraft manufacturers reached 1.24 in 2024 while in 2023 was 2.69.
General Note.— The statistical data for 2024 appearing in this Report are to be considered as preliminary. Experience shows that the margin of error for world totals is probably less than 2 per cent, except in the case of financial data where it may be considerably higher. Unless otherwise noted:
a) all statistical data are applicable to ICAO Member States;
b) traffic statistics are for revenue scheduled services;
c) the expression “tonne-kilometre” means metric tonne-kilometre;
d) total airline financial statistics relate to scheduled as well as non-scheduled services of scheduled airlines.
Aviation safety
There were 95 aircraft accidents for scheduled commercial air transport operations in 2024, an increase from the 66 accidents reported by the Member States in 2023. This is according to an analysis of global accident data involving commercial air transport aeroplanes with a maximum certificated take-off mass of more than 5 700 kilograms. The number of fatalities in scheduled operations worldwide stood at 296 in 2024. The number of fatal accidents notably increased from one in 2023 to 10 in 2024. The global accident rate was 2.56 accidents per million scheduled departures, versus 1.87 accidents per million scheduled departures in 2023.
Unlawful Interference
31 acts of unlawful interference were recorded. These included:
10 attacks on aircraft in flight
15 attacks on airports or other aviation facilities
0 attacks using aircraft as a weapon
2 cyber-attacks endangering aviation safety
4 unlawful seizures of aircraft
and 0 other attacks.
Details concerning all 2024 events are available in the Acts of Unlawful Interference Database, which is accessible through ICAO’s secure website.
General Note.— The statistical data for 2024 appearing in this Report are to be considered as preliminary. Experience shows that the margin of error for world totals is probably less than 2 per cent, except in the case of financial data where it may be considerably higher. Unless otherwise noted:
a) all statistical data are applicable to ICAO Member States;
b) traffic statistics are for revenue scheduled services;
c) the expression “tonne-kilometre” means metric tonne-kilometre;
d) total airline financial statistics relate to scheduled as well as non-scheduled services of scheduled airlines.