The World of Air Transport in 2018
According to ICAO’s preliminary compilation of annual global statistics, the total number of passengers carried on scheduled services rose to 4.3 billion in 2018, which is 6.4 per cent higher than the previous year, while the number of departures reached 37.8 million in 2018, a 3.5 per cent increase. Detailed air transport statistics appear on the Presentation of 2018 Air Transport Statistical Results page.
Passenger traffic (total scheduled revenue passenger-kilometres performed (RPKs))
Total increase: 7.1 per cent, equating to 8 258 billion RPKs
|
Change by region – | |
| Europe: | 26.3 per cent of world traffic, posting growth of 7.2 per cent |
| Africa: | 2.1 per cent of world traffic, posting growth of 7.5 per cent |
| Middle East: | 9.2 per cent of world traffic, posting growth of 3.9 per cent |
| Asia and Pacific: | 34.8 per cent of world traffic, posting growth of 9.5 per cent |
| North America: | 22.4 per cent of world traffic, posting growth of 4.7 per cent |
| Latin America and Caribbean: | 5.1 per cent of world traffic, posting growth of 7.7 per cent |

More comprehensive air transport data are available at:
http://www4.icao.int/newdataplus
International scheduled passenger traffic
Total growth: 6.8 per cent in RPKs
|
Change by region: | |
| Europe: | 36.6 per cent of total RPK, posting growth of 7.5 per cent |
| Africa: | 2.8 per cent of total RPK, posting growth of 4.8 per cent |
| Middle East: | 13.9 per cent of total RPK, posting growth of 4.3 per cent |
| Asia and Pacific: | 30.3 per cent of total RPK, posting growth of 8.6 per cent |
| North America: | 12.2 per cent of total RPK, posting growth of 3.8 per cent |
| Latin America and Caribbean: | 4.3 per cent of total RPK, posting growth of 7.8 per cent |
Domestic scheduled passenger traffic
Total growth: 7.7 per cent in RPKs
|
Change by region: | |
| Europe: | 9.0 per cent of total RPK, posting growth of 5.4 per cent |
| Africa: | 1.0 per cent of total RPK, posting growth of 21.9 per cent |
| Middle East: | 1.1 per cent of total RPK, posting decline of -3.4 per cent |
| Asia and Pacific: | 42.4 per cent of total RPK, posting growth of 10.6 per cent |
| North America: | 39.9 per cent of total RPK, posting growth of 5.2 per cent |
| Latin America and Caribbean: | 6.6 per cent of total RPK, posting growth of 7.6 per cent |
Low-cost Carriers
Low-cost carriers carried an estimated 1.3 billion passengers in 2018, which was approximately 31 per cent of the world total scheduled passengers. This indicated an 8.7 per cent growth when compared to the number of passengers carried by low-cost carriers in 2017, around 1.4 times the rate of the world total average passenger growth.
Available seat-kilometres (ASK) capacity
Total Growth: 6.6 per cent
|
Change by region: | |
| Europe: | 25.6 per cent of total ASK, with passenger load factor of 84.0 per cent |
| Africa: | 2.4 per cent of total ASK, with passenger load factor of 72.6 per cent |
| Middle East: | 10.1 per cent of total ASK, with passenger load factor of 74.5 per cent |
| Asia and Pacific: | 34.8 per cent of total ASK, with passenger load factor of 81.7 per cent |
| North America: | 21.9 per cent of total ASK, with passenger load factor of 83.6 per cent |
| Latin America and Caribbean: | 5.2 per cent of total ASK, with passenger load factor of 80.9 per cent |
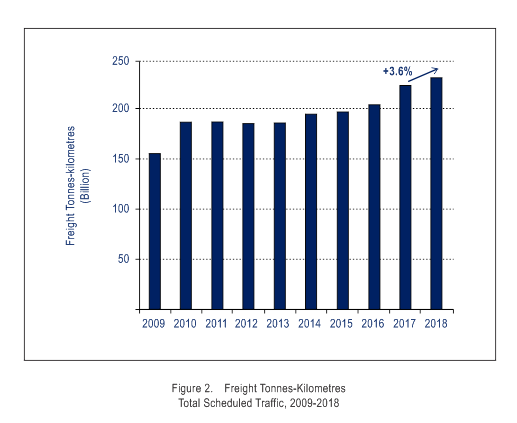
Freight traffic
Total tonnes carried: 58.0 million
| Growth of scheduled total freight traffic, expressed in terms of scheduled total freight tonne-kilometres performed (FTKs): 3.6 per cent | |
Growth of total scheduled
international freight traffic, expressed in terms of FTKs performed: 3.7 per cent
|
And by region: | |
| Europe: | 26.1 per cent of total FTKs performed, posting growth of 3.7 per cent |
| Africa: | 2.0 per cent of total FTKs performed, posting decline of -0.4 per cent |
| Middle East: | 16.2 per cent of total FTKs performed, posting growth of 5.0 per cent |
| Asia and Pacific: | 38.7 per cent of total FTKs performed, posting growth of 2.5 per cent |
| North America: | 14.3 per cent of total FTKs performed, posting growth of 5.9 per cent |
| Latin America and Caribbean: | 2.8 per cent of total FTKs performed, posting growth of 6.0 per cent |
Scheduled international freight capacity in 2018, expressed in available freight tonne-kilometres, was approximately 363 billion, a 3.4 per cent growth compared to 2017. The scheduled international freight load factor remained unchanged at 55 per cent.
Operating profit of scheduled airlines of Member States
Estimated at about 6.3 per cent of operating revenues, this represents an operating profit expected to be around USD 50.9 billion in 2018 based on operating revenues of USD 814 billion.
A detailed variance analysis of changes in operating profits appears in the Presentation of 2018 Air Transport Statistical Results, Table 9.
Long-term air traffic forecasts
The 4.3 billion airline passengers carried in 2018 are expected to grow to about 10.0 billion by 2040, and the number of departures is projected to rise to some 90 million in 2040.
Aircraft
The world’s major manufacturers delivered 1 606 new commercial aircraft in 2018 and recorded 1 640 new aircraft net orders.
Book-to-bill ratios for two of the largest aircraft manufacturers decreased to around 1.02 in 2018 from 1.40 in the previous year.
Aviation safety
There were 98 aircraft accidents for scheduled commercial air transport operations in 2018, an increase of 11 per cent from 2017, when 88 accidents were reported. This is according to an analysis of global accident data involving commercial air transport aircraft with a maximum certificated take-off mass of more than 5 700 kilograms. The number of fatalities in scheduled operations worldwide stood at 514, resulting from 11 fatal accidents. The global accident rate increased to 2.6 accidents per million schedule departures versus 2.4 accidents per million scheduled departures in 2017.
Unlawful Interference
36 acts of unlawful interference were recorded. These included:
0 attacks on aircraft in flight
16 attacks on airports or other aviation facility
1 attack using aircraft as a weapon
1 cyber-attack endangering aviation safety
2 unlawful seizures of aircraft
and 16 other attacks.
Details concerning all 2018 events are available in the Acts of Unlawful Interference Database, which is accessible through ICAO’s secure website.
