The World of Air Transport in 2020
Once again this year, and despite the exceptional circumstances faced by the aviation industry, the reported data by ICAO Member States presented in the
Annual Report of the Council achieved the exceptional level of 98.6 per cent of global coverage. It is important to note that ICAO official statistics present the highest level of reporting coverage compared to any other source of global aviation data. It shows once again the trust the Member States have in official reporting and their confidence in ICAO data.
More details about ICAO aviation data and products:
https://data.icao.int/icads/
E-mail Contact:
cads@icao.int
According to ICAO’s preliminary compilation of annual global statistics, the total number of passengers carried on scheduled services declined to 1.8 billion in 2020, which is 60.1 per cent lower than the previous year, with the number of departures declining to 20.3 million in 2020, a 47.1 per cent decline. Detailed air transport statistics appear on the Presentation of 2020 Air Transport Statistical Results page.
Note.— The sum of the individual regions may not match the totals due to rounding.
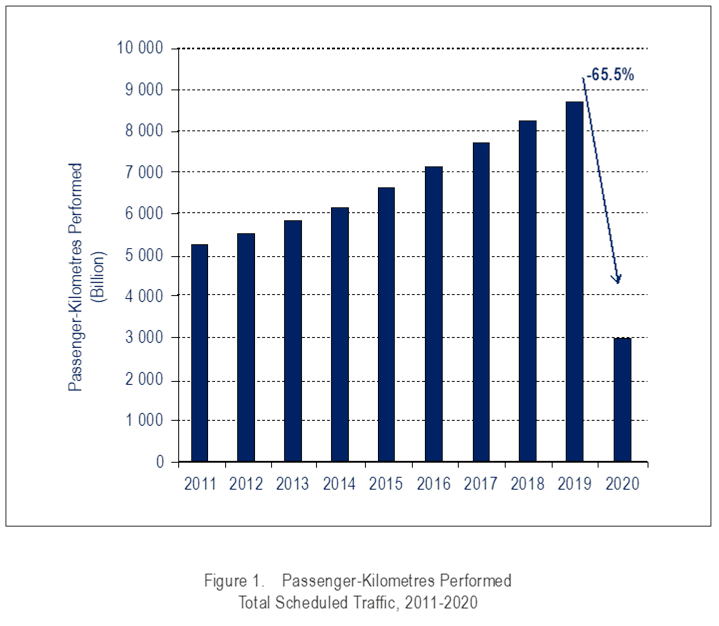
Passenger traffic (total scheduled revenue passenger-kilometres performed (RPKs))
Total decline: 65.5 per cent, equating to 2 990 billion RPKs
|
Change by region: |
|
| Europe: | 23.5 per cent of world traffic, posting decline of 69.6 per cent |
| Africa: | 2.0 per cent of world traffic, posting decline of 68.1 per cent |
| Middle East: | 8.6 per cent of world traffic, posting decline of 67.7 per cent |
| Asia and Pacific: | 38.0 per cent of world traffic, posting decline of 62.2 per cent |
| North America: | 22.5 per cent of world traffic, posting decline of 65.2 per cent |
| Latin America and Caribbean: | 5.4 per cent of world traffic, posting decline of 62.9 per cent |
More comprehensive air transport data are available at:
https://data.icao.int/newdataplus
International scheduled passenger traffic
Total decline: 75.4 per cent in RPKs
|
Change by region: |
|
| Europe: | 39.4 per cent of total RPK, posting decline of 73.9 per cent |
| Africa: | 3.5 per cent of total RPK, posting decline of 69.5 per cent |
| Middle East: | 16.9 per cent of total RPK, posting decline of 70.0 per cent |
| Asia and Pacific: | 23.5 per cent of total RPK, posting decline of 80.7 per cent |
| North America: | 12.1 per cent of total RPK, posting decline of 75.3 per cent |
| Latin America and Caribbean: | 4.6 per cent of total RPK, posting decline of 72.8 per cent |
Domestic scheduled passenger traffic
Total decline: 48.7 per cent in RPKs
|
Change by region: | |
| Europe: | 10.4 per cent of total RPK, posting decline of 39.1 per cent |
| Africa: | 0.7 per cent of total RPK, posting decline of 61.5 per cent |
| Middle East: | 1.8 per cent of total RPK, posting decline of 21.0 per cent |
| Asia and Pacific: | 49.9 per cent of total RPK, posting decline of 40.0 per cent |
| North America: | 31.0 per cent of total RPK, posting decline of 60.0 per cent |
| Latin America and Caribbean: | 6.1 per cent of total RPK, posting decline of 52.4 per cent |
Low-cost Carriers
Low-cost carriers carried an estimated 539 million passengers in 2020, which was approximately 30 per cent of the world total scheduled passengers. This indicated a 60.9 per cent decline when compared to the number of passengers carried by low-cost carriers in 2019.
Available seat-kilometres (ASK) capacity
Total decline: 56.5 per cent, passenger load factor of 65.3 per cent
|
Change by region: | |
| Europe: | 22.5 per cent of total ASK, with passenger load factor of 68.1 per cent |
| Africa: | 2.1 per cent of total ASK, with passenger load factor of 60.8 per cent |
| Middle East: | 9.4 per cent of total ASK, with passenger load factor of 59.9 per cent |
| Asia and Pacific: | 36.6 per cent of total ASK, with passenger load factor of 67.8 per cent |
| North America: | 24.6 per cent of total ASK, with passenger load factor of 59.6 per cent |
| Latin America and Caribbean: | 4.7 per cent of total ASK, with passenger load factor of 74.8 per cent |
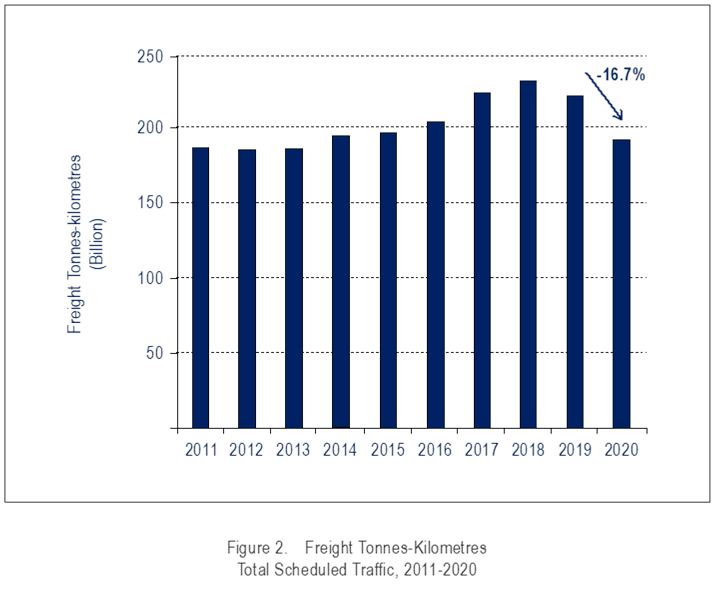
Freight traffic
Total millions of tonnes carried: 48.9
| Decline of scheduled total freight traffic, expressed in terms of scheduled total freight tonne-kilometres performed (FTKs): -16.7 per cent | |
Decline of total scheduled
international freight traffic, expressed in terms of FTKs performed: -20.3 per cent
And by region:
| |
| Europe: | 22.4 per cent of total FTKs performed, posting a decline of -22.6 per cent |
| Africa: | 2.0 per cent of total FTKs performed, posting decline of -12.8 per cent |
| Middle East: | 14.6 per cent of total FTKs performed, posting a decline of -13.1 per cent |
| Asia and Pacific: | 35.5 per cent of total FTKs performed, posting a decline of -20.4 per cent |
| North America: | 22.7 per cent of total FTKs performed, posting a decline of -5.5 per cent |
| Latin America and Caribbean: | 2.8 per cent of total FTKs performed, posting a decline of -16.8 per cent |
Scheduled international freight capacity in 2020, expressed in available freight tonne-kilometres, was approximately 280 billion, a decline of 25.9 per cent compared to 2019. The scheduled international freight load factor increased to 57 per cent.
Operating profit of scheduled airlines of Member States
Estimated at about a negative 29.4 per cent of operating revenues, operating loss is expected to be around USD 112.0 billion in 2020 based on operating revenues of USD 381 billion.
A detailed variance analysis of changes in operating profits appears in the Presentation of 2020 Air Transport Statistical Results, Table 9.
Long-term air traffic forecasts
The post-COVID long-term forecasts developed by the Secretariat and the Multi-Disciplinary Working Group on Long-term Traffic Forecasts revolve around three scenarios (low, mid and high). In the mid scenario, the passenger traffic expressed in revenue passenger-kilometers is expected to grow 3.6 per cent annually in the next 20 years.
https://www.icao.int/sustainability/Pages/Post-Covid-Forecasts-Scenarios.aspx
Aircraft
The world’s major manufacturers delivered 723 new commercial aircraft in 2020 and recorded 452 new aircraft net orders. Book-to-bill ratios for two of the largest aircraft manufacturers decreased to around 0.63 in 2020 from 0.66 in the previous year.
Aviation safety
There were 48 aircraft accidents for scheduled commercial air transport operations in 2020, compared to 114 accidents in 2019. This is according to an analysis of global accident data involving commercial air transport aircraft with a maximum certificated take-off mass of more than 5 700 kilograms. The number of fatalities in scheduled operations worldwide stood at 298, resulting from four fatal accidents. The global accident rate was 2.14 accidents per million scheduled departures, versus 2.94 accidents per million scheduled departures in 2019.
Unlawful Interference
12 acts of unlawful interference were recorded. These included:
2 attacks on aircraft in flight
3 attacks on airports or other aviation facility
0 attacks using aircraft as a weapon
0 cyber-attacks endangering aviation safety
1 unlawful seizure of aircraft
and 6 other attacks.
Details concerning all 2020 events are available in the Acts of Unlawful Interference Database, which is accessible through ICAO’s secure website.
