Introduction
Through ICAO's Committee on Aviation Environmental Protection (CAEP), ICAO has recently completed a global Horizontal Flight Efficiency (HFE) analysis as the first of a multi-step process to identify global flight efficiency. To assess HFE, the group collected raw input data from a commercial supplier of ADS-B surveillance data and translated that data into a format that could be analysed and subsequently validated.
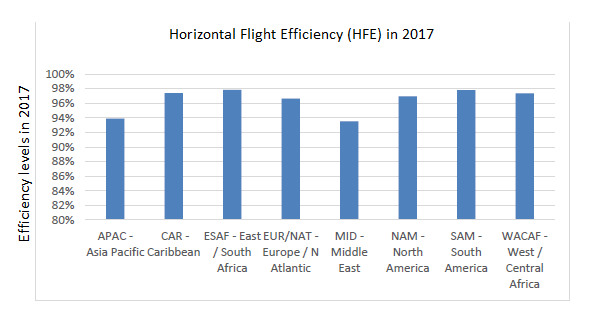
The final HFE results for 2017, expressed in efficiency levels (%), are detailed below:
Background and previous studies
- In the 1999 Intergovernmental Panel on Climate Change (IPCC) report, Aviation and the Global Atmosphere, it was estimated that improvements in ATM and other operational procedures could reduce aviation fuel burn by between 8% and 18%. The large majority (6% to 12%) of these reductions were estimated to come from ATM improvements which it was anticipated would be fully implemented in the 20 years following the report.
- In 2008, the Civil Air Navigation Services Organisation (CANSO), in its ATM Global Environment Efficiency Goals for 2050 report, estimated that the Global ATM system was already between 92% and 94% fuel efficient.
- In 2008, using the CANSO report as a baseline, CAEP estimated the environmental goals that improved ATM operations could deliver in 10 and 20 year milestones by performing an assessment of regional operational efficiency scaled up to the global level. This included analyses on HFE, vertical flight efficiency (VFE), delays and flow, and airport and terminal area. Where data was not available, IATA data was used to estimate the future efficiency goals. CAEP estimated that operational efficiency goals would be between 92-95% in 2016 and 93-96% in 2026.
- The original objective of this task was to estimate a global benefit opportunity pool to be used as a sanity check for the ASBU benefit estimation, which requires a focus on fuel burn rather than deviation of actual distance flown from a shortest path within a region. However, the complexity of the issues raises and concerns about the level of resources available, prevented CAEP from completing such a detailed task during this CAEP cycle (2019-2022), and the accomplished analysis proved to be the first step that was feasible.
Results
- The study was a global first:
- To measure global HFE (relative to a theoretical optimum in en-route airspace);
- By using a global harmonised data source; and,
- By using actual surveillance data.
- The results show that efficiency levels in 2017, based on the data studied, vary between 94-98%, compared to those estimated by CANSO (92-94%) in 2008 and CAEP (91-94%) in 2009 although it should be noted that the efficiencies assessed in those studies included an analysis of both horizontal and vertical flight efficiency. There are two distinct outliers in the results: MID and APAC. It was not the aim of the study to identify the reasons for regional efficiency levels but it is quite clear than ongoing political instability in the former has contributed to more inefficient routings although causes for inefficiency in APAC are not so obvious. Based on the maturity of ATC systems, it appears that there may also be a link between airspace capacity and efficiency levels whilst there may be a requirement for some level of inherent inefficiency in order to maintain the dynamicity of the global and regional system. Whilst such an inherent inefficiency level cannot be determined from this analysis, it could be a good topic to assess in future studies.
Potential limitations with HFE studies
- Whilst HFE should not be confused with ATM efficiency or global flight efficiency (as HFE may encompass inefficiencies driven by non-ATM factors such as safety, traffic demand, winds and airspace availability), for the purpose of this analysis, HFE was considered by CAEP as the first step in assessing global flight efficiency.
- Since HFE in en-route airspace was estimated as relative to a theoretical optimum, routing restrictions that may have been applicable at the time of flight were not directly addressed. In addition, it should be understood that whilst some ATM inefficiencies are caused by external factors such as convective weather, airport meteorological conditions, community issues, constraints from other nearby airport flows, or demand for services that exceed airspace capacity, it is likely that there would always be some operational inefficiency that is very difficult or impossible to remove. Indeed, experts agree that there will always be an amount of latent inefficiency required within the system to allow the system to successfully function whilst capacity-driven inefficiencies may be embedded in the baseline.
- It should be also noted that limitations exist relating to the use of minimum route lengths (great circle) as an indicator for fuel efficiency and CO2 emissions as flights across specific airspaces e.g. the North Atlantic, or between certain city pairs e.g. Australia / New Zealand may benefit from wind-assisted routes. Consequently, with strong winds, particularly where jet streams exist, the most fuel-efficient route will be longer than the great circle distance. Whilst, current understanding is that wind –assisted routes are more likely to occur in those airspaces where current ADS-B surveillance is not available and thus, outside of the analysis, the level of analysis does not allow an isolation of only non-wind assisted routes.
Metric
- The performance indicator used in the study was a variant of KPI05, a potential performance indicator presented in the ICAO Global Air Navigation Plan (GANP) 2016. KPI05 refers to the ‘actual en-route extension’ which compares the actual en-route distance flown compared to a reference ideal distance.
- This study used the mathematical tool at the core of the European Performance Scheme’s methodology to calculate the ‘achieved distance’, adapted to the data type (ADS-B), data availability (typically over continental airspace) at hand and ICAO regional boundaries (as opposed to the normal entry/exit into European airspace) to estimate the average horizontal flight efficiency of each ICAO region for the year 2017.
Potential imitations of ADS-B data
- The ADS-B surveillance data used to calculate the HFE results in this analysis, were subject to several validation checks. In addition, in an attempt to focus this empirical analysis on commercial operations, ADS-B surveillance inputs above FL100 were used to estimate global HFE in en-route airspace i.e. low level ADS-B equipped flights (with a cruising level below FL100) and general aviation aircraft / gliders were excluded from the analysis during the data cleaning and validation processes.
- Data gaps prevented this analysis from addressing any potential differences in HFE for the operations not using ADS-B surveillance, or in those parts of ICAO regions with insufficient ADS-B coverage. Whilst emphasising that movement coverage figures do not represent ADS-B equipage levels, the average movement coverage across the ICAO regions ranged between 35% to 95% with the global movement coverage estimated at 68%. Therefore, in regions with lower levels of ADS-B surveillance or equipped fleets, the results were based on a smaller dataset.
- As this analysis was based only on those aircraft movements for those areas with sufficient ADS-B surveillance data available. it did therefore not include those airspaces where ADS-B surveillance was absent which coincidentally were those airspaces where traditionally, time-based parameters may be considered more appropriate for measuring HFE e.g. over the Indian Ocean. In addition, traffic flows in those areas where the lack of availability of Communication, Navigation and Surveillance (CNS) infrastructure traditionally may result in a less than optimum flight trajectory e.g. over the North Atlantic, were also not represented in any results.
- It should also be noted that in order to estimate global movement coverage figures, as the latest comparative global traffic data set available was from 2015, assumptions were made to generate traffic increases to 2017 levels by using global data from only the top 15 airlines / ICAO traffic monitor reports (therefore representing global and not regional trends). Other assumptions in the analysis included seasonality representativeness and traffic consistency.
Next steps on the path to assessing global flight efficiency
- In accordance with the conclusions of CAEP, namely that HFE is considered the first step in assessing global flight efficiency and based upon the availability of data, CAEP considers that further steps would also need to address vertical flight efficiency, the relationship between HFE and VFE, efficiency in terminal airspaces and on airport surfaces around the world, as well as trying to fill those data gaps that were identified in this analysis.
- As such, CAEP is proposing to continue the work on global flight efficiency by undertaking a global VFE analysis in the CAEP/12 cycle. This work may include not only as assessment of the extent of VFE per region, but also an assessment of the fuel / CO2 / cost penalties that would result from any such inefficiency.
- Future availability of global space-based ADS-B surveillance data may provide a source of global data that can address some of these steps. In addition, normalising for demand growth and other non-ATM factors would be other additional steps that could be proposed to isolate benefit opportunities associated with future ATM improvements.
