Trends in Emissions that affect Climate Change
The first ICAO Global Environmental Trends were presented and endorsed at the 37th Session of the Assembly, and since then the updated global environment trends have been developed and presented to every Assembly Session to form the basis for their considerations and decisions.
The most recent environmental trends are based on data from the latest CAEP/12 air travel mid demand forecast. The forecast utilized a base year of 2018 and future years of 2019, 2020, 2024, 2030, 2040, 2050, and 2070. The passenger and cargo forecasts were derived from ICAO’s Long-Term Traffic Forecast (LTF), while the business jet forecast was developed from a new International Business Aviation Council (IBAC) aircraft delivery forecast. The traditional forecast development process was adjusted to account for the continued effect of COVID-19 on economic activity and traffic demand. Uncertainty around the effect of the pandemic on traffic demand is acknowledged through a series of forecast scenarios.
In 2018, approximately 65% of global aviation fuel consumption was from international aviation. According to the CAEP/13 traffic demand forecast, this proportion is expected to remain relatively stable out to 2050. Data presented for years earlier than 2018 are reproduced from prior CAEP trends assessments.
The trends presented here were developed in the context of a longer-term view, assuming no airport infrastructure or airspace operational constraints. However, these trends may be substantially impacted by a wide range of factors, including fluctuations in fuel prices, uptake of SAF, and global economic conditions, including any residual effects of recovery from the COVID-19 pandemic.
Traffic Demand Forecasts and COVID-19
The CAEP/13 environmental trends traffic demand forecast has a 2018 base year and 32-year forecast horizon through 2050 with an additional forecast extension going out to 2070. It represents an update of the CAEP/12 forecast which had the same 2018 base year, reflecting changes in global economic activity, including revised near-term traffic demand that was still being influenced by the recovery from the effects of the COVID-19 pandemic. The traditional forecast development process was adjusted to account for the continued effect of COVID-19 on economic activity and traffic demand. Uncertainty around the effect of the pandemic on traffic demand is acknowledged through a series of forecast scenarios.
Trends in Aircraft Fuel Burn and CO2 Emissions
The green-house gas (GHG) portion of the trends assessment evaluated potential contributions of operational and technology improvements to reducing projected fuel demand and associated future emissions, focusing on combustion CO2 emissions. The results are based on the 2018- 2070 post-COVID traffic and fleet forecast, representing conventional fuel consumption, CO2 emissions (i.e., CO2 emitted during flight only), and NOx and nvPM emissions. The results contain the alternative fuel analyses, including the potential contribution of SAF on CO2 net life-cycle emissions.
The greenhouse gas (GHG) trends assessment includes full-flight fuel consumption, CO2, NOx and non-volatile particulate matter (nvPM) results for international operations out to 2070. As shown in Figure 1, for 2050 and for Fuel Scenario 3 (lower bound), aircraft technology accounts for a reduction of 81 Mt and operations accounts for an additional 34 Mt for a total reduction of 115 Mt, as compared with Fuel Scenario 1. For 2070 Fuel Scenario 3 (lower bound) aircraft technology accounts for a reduction of 271 Mt and operations accounts for an additional 85 Mt for a total reduction of 356 Mt as compared with Fuel Scenario 1. Overall, Fuel Scenario 3 results in 27% and 46% reduction in fuelburn as compared with Fuel Scenario 1 in 2050 and 2070, respectively. Considering Fuel Scenario 3 (lower bound), an average fuel efficiency of 1.5% would be observed by 2050, increasing to about 1.6% by 2070. This would represent lower improvements compared to the ICAO 2% fuel efficiency aspirational goal for international aviation.
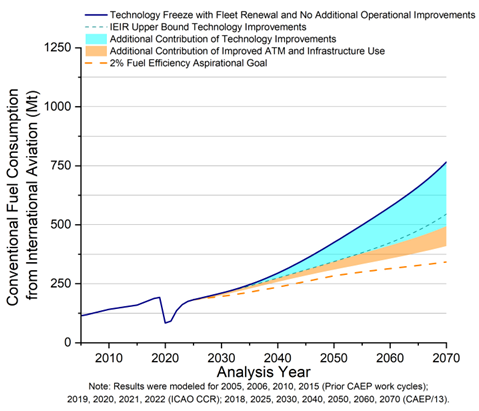
Figure 1. Conventional Fuel Consumption from International Aviation from 2005 to 2070.
As shown in Figure 2 for international aviation, for the year 2050, with the replacement with sustainable aviation fuels (SAF), lower carbon aviation fuels (LCAF) and other aviation cleaner energies, there is a 53% reduction in residual CO2 emissions in addition to the reduction from technology and operations improvements. In 2070, with the replacement with SAF, LCAF and other aviation cleaner energies, there is a 53% reduction in residual CO2 in addition to the reduction from technology and operations improvements. Fuels based on biomass, solid/liquid wastes, and gaseous wastes are considered as SAF, while for the latter the carbon source in the fuel feedstock comes from waste CO/CO2.
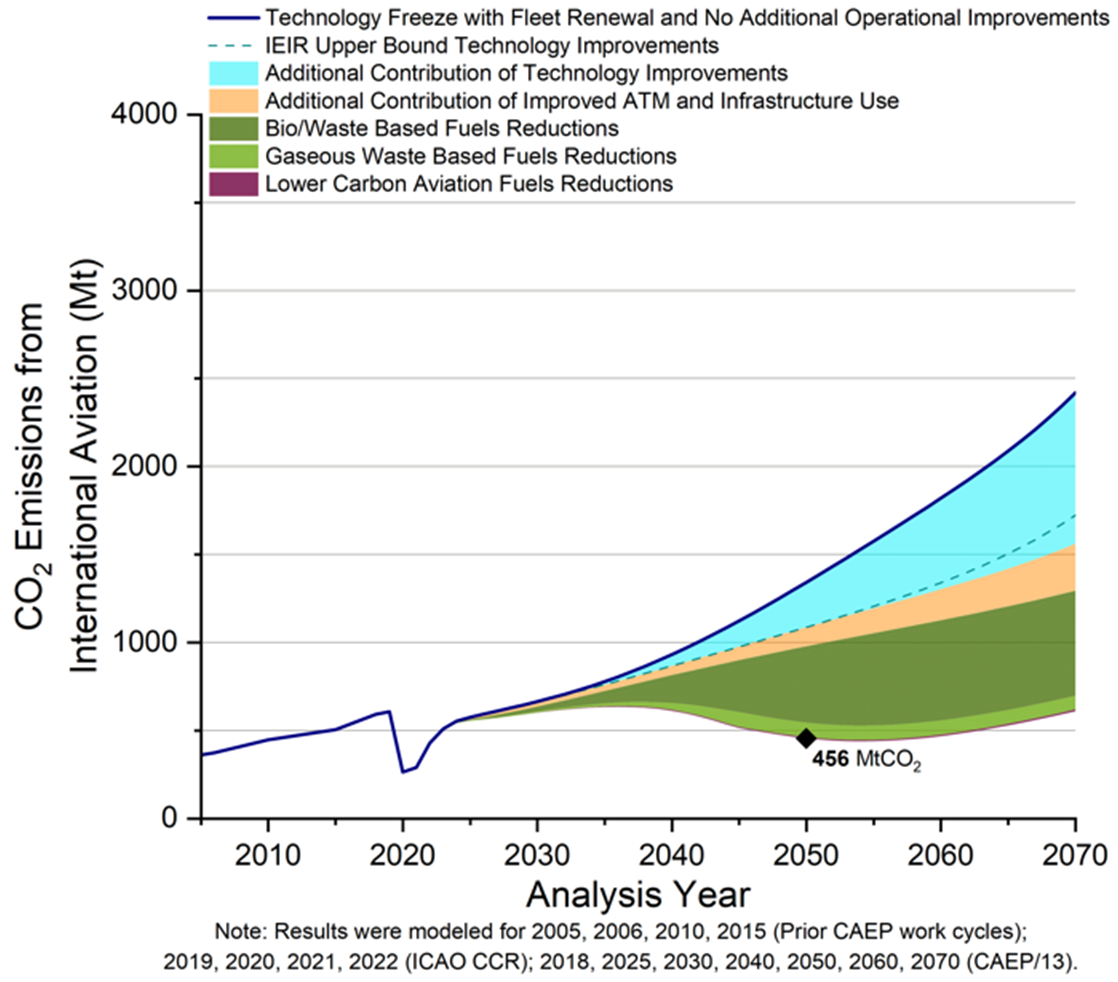
Figure 2. Combustion CO2 Emissions from International Aviation, 2005 to 2070, Including Life Cycle Emissions Reductions from SAF, LCAF and other aviation cleaner energies.
Trends in Aircraft Full-Flight NOx and nvPM Emissions
Figure 3 shows the full flight NOx trend for international aviation. With technology and operational improvements (NOx Scenario 3), for the year 2050 there is a combined reduction of 2.2 Mt for international aviation. This amounts to a 27% reduction in NOx relative to NOx Scenario 1. For the year 2070 there is a combined reduction of 4.6 Mt for international aviation. This amounts to a 31% reduction in NOx relative to NOx Scenario 1.
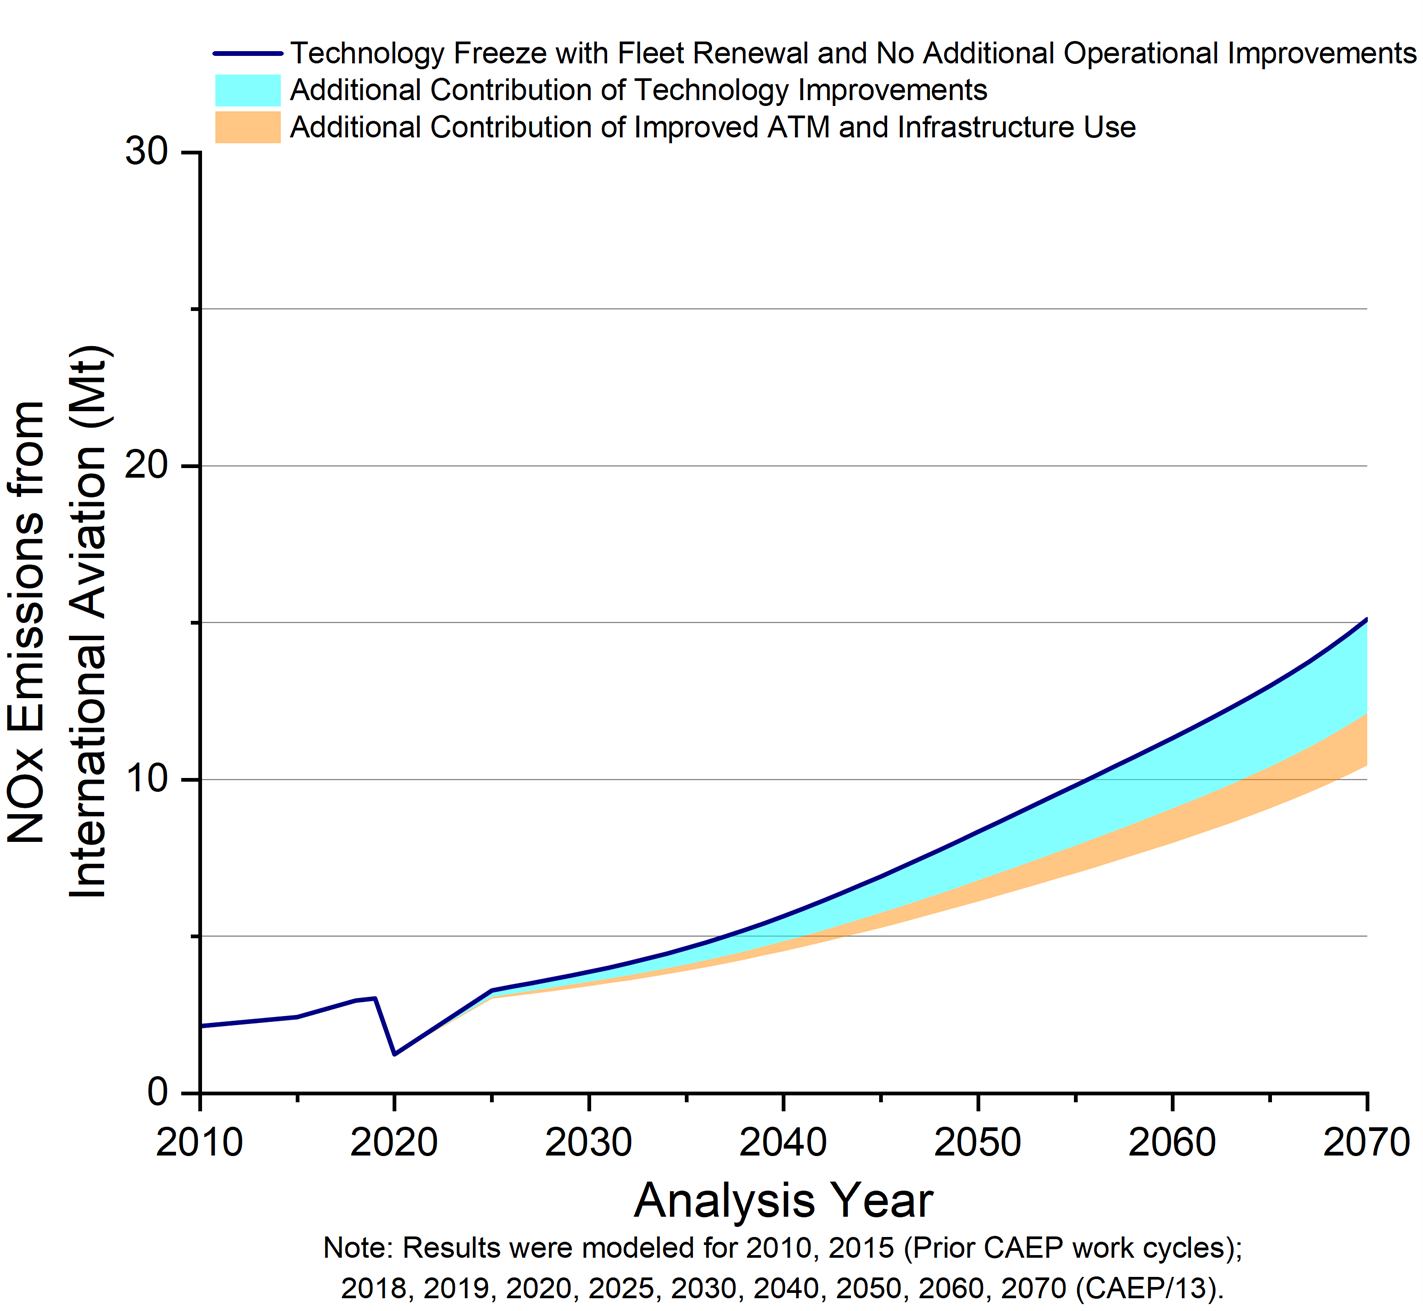
Figure 3. Full Flight NOx Emissions from International Aviation, 2010 to 2070.
Figure 4 shows the full flight nvPM trend for international aviation. With technology and operational improvements (nvPM Scenario 3), for the year 2050 there is a combined reduction of 6.1 kt for international aviation. This amounts to a 43% reduction in nvPM from nvPM Scenario 1. For the year 2070 there is a combined reduction of 11.8 kt for international aviation. This amounts to a 48% reduction in nvPM from nvPM Scenario 1.
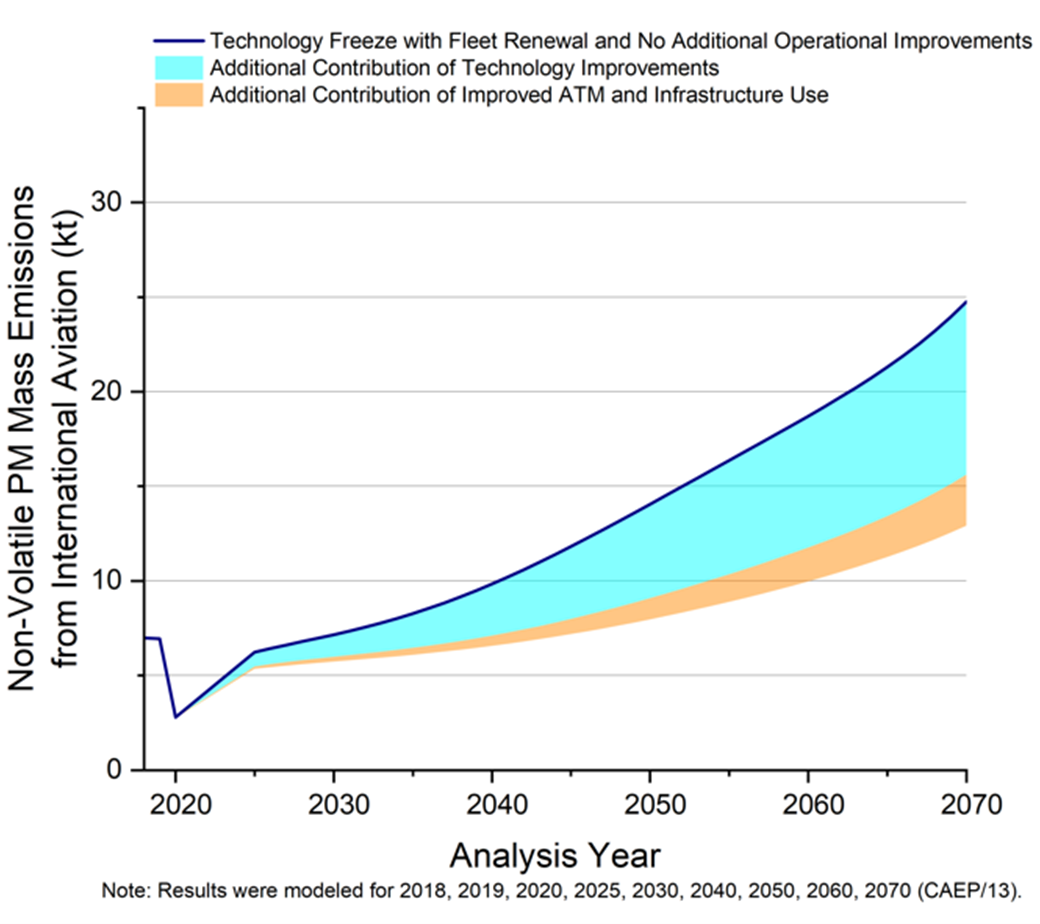
Figure 4. Full Flight nvPM Emissions from International Aviation, 2018 to 2070.