The World of Air Transport in 2017
According to ICAO’s preliminary compilation of annual global statistics, the total number of passengers carried on scheduled services rose to 4.1 billion in 2017, which is 7.2 per cent higher than the previous year, while the number of departures reached 36.7 million in 2017, a 3.1 per cent increase compared to 2016. Detailed air transport statistics appear on the Presentation of 2017 Air Transport Statistical Results page.
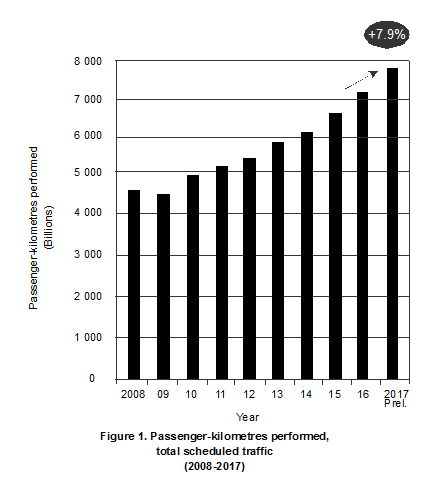
Passenger traffic, expressed in terms of total scheduled revenue passenger-kilometres performed (RPKs), posted an increase of 7.9 per cent, with approximately 7 699 billion RPKs performed in 2017. Asia/Pacific remained the largest region with 34 per cent of world traffic, posting a 10.7 per cent growth in 2017, followed by Europe with 27 per cent of world traffic and a growth of 8.6 per cent. North America, which accounts for 23 per cent of world traffic, grew at 4.1 per cent. The Middle East region, representing 9 per cent of world traffic, recorded a growth rate of 6.5 per cent. The Latin America/Caribbean region accounted for 5 per cent of world traffic and grew at 7.4 per cent. The remaining 2 per cent of world traffic was undertaken by African region airlines, which recorded a growth of 7.2 per cent.
More comprehensive air transport data are available at:
http://www4.icao.int/newdataplus
International scheduled passenger traffic grew by 8.4 per cent in RPKs in 2017, compared to the 7.7 per cent growth recorded in 2016. European air carriers saw growth of 8.8 per cent and accounted for the largest share of international RPKs, at 37 per cent of the total. Asia/Pacific retained the second largest share at 29 per cent. The growth for this region was 10.5 per cent. The Middle East accounted for 14 per cent of international RPKs and recorded a growth of 6.5 per cent in 2017, significantly lower than the double-digit growth recorded in 2016. North America which accounts for a share of 13 per cent of international RPKs, grew by 4.9 per cent. African carriers, which account for 3 per cent of international RPKs, grew by 8.1 per cent. Carriers of Latin America/Caribbean which account for a share of 4 per cent of international RPKs experienced a 9.1 per cent growth in 2017.
Domestic scheduled passenger traffic grew by 7.1 per cent in RPKs in 2017, up from the 6.9 per cent growth recorded in 2016. The main drivers of this growth were the carriers of the United States, China and India which saw increased growth by 3.6, 13.2 and 17.7 per cent, respectively. The Asia/Pacific region, with a share of 42 per cent, overtook North America to become the world’s largest domestic market and grew strongly by 11.0 per cent in 2017. North America, with a 41 per cent share of domestic RPKs, experienced a 3.7 per cent growth in 2017. Carriers of Europe, accounting for 9 per cent of domestic RPKs, saw a growth of 7.3 per cent in 2017. The Latin America/Caribbean region, which accounts for a 7 per cent share, saw growth of 5.6 per cent while carriers of the Middle East and Africa, saw a growth of 5.9 per cent and 2.2 per cent, respectively.
Low-cost carriers carried an estimated 1.2 billion passengers in 2017, which was approximately 30 per cent of the world total scheduled passengers. This indicated a 11.4 per cent growth when compared to the number of passengers carried by low-cost carriers in 2016, around one and a half times the rate of the world total average passenger growth.
Capacity offered by the world’s airlines, expressed as available seat-kilometres, increased globally by 6.5 per cent in 2017. The capacity growth ranged from 3.8 per cent in Africa to 8.8 per cent in the Asia/Pacific. The average 2017 global passenger load factor at 81.3 per cent was a per cent higher than achieved in the previous year, and ranged from 70.8 per cent for Africa to 83.6 per cent for Europe.
Approximately 56 million tonnes of freight were carried in 2017. Growth of scheduled total freight traffic, expressed in terms of scheduled total freight tonne-kilometres performed (FTKs), was at 9.5 per cent in 2017, significantly higher than the 3.6 per cent recorded in 2016. This growth was mainly due to the improving trade activity in 2017.

Scheduled international FTKs posted an increase of 10.4 per cent in 2017, compared to the 3.5 per cent growth of 2016. International air freight represented around 87 per cent of total scheduled FTKs. Air carriers in Asia/Pacific carried nearly 40 per cent of scheduled international FTKs; the figure was 26 per cent for carriers in Europe, 16 per cent for the Middle East, and 14 per cent for those in North America. This indicated that nearly 80 per cent of long-haul freight traffic flowed on the East-West trade lane that connects Asia to Europe, Asia to North America, and Europe to North America.
Scheduled international freight capacity in 2017, expressed in available freight tonne-kilometres, was approximately 351 billion, a 6.1 per cent growth compared to 2016. The scheduled international freight load factor increased from 53.2 per cent in 2016 to 55.4 per cent in 2017. A combination of improving economic activity, trade and growth in e-commerce contributed to the net positives for air freight in 2017.
In 2017, the operating profit of scheduled airlines of Member States was estimated at about 7.9 per cent of operating revenues. The operating profit was expected to be around USD 60 billion in 2017 based on operating revenues of USD 758 billion. Nearly 49 per cent of the net profits came from the performance of air carriers in North America, followed by carriers of Asia/Pacific and Europe with 25 and 26 per cent, respectively. The 24 per cent increase in jet fuel price in 2017 led to an increase in unit costs compared to the decline seen in 2016. Higher traffic growth, a more efficient utilization of capacity and slowing of the decline in yields compared to previous years offset the negative of the increase in unit costs and contributed to another profitable year for the air carrier industry in 2017. A detailed variance analysis of changes in operating profits appears in the Presentation of 2017 Air Transport Statistical Results, Table 9.
After an estimated 3.1 per cent growth in real Gross Domestic Product (GDP) in 2017, the World Bank has forecasted the growth to remain unchanged at 3.1 per cent GDP for 2018. Accordingly, ICAO has forecasted that total passenger traffic will grow by about 7.5 per cent in 2018. The operating profit for the industry is expected to be around USD 56 billion in 2018 due to the combined effects of improving economic growth, continuing traffic growth and better capacity utilization that is expected to offset the increase in jet fuel prices in 2018.
According to the latest ICAO long-term air traffic forecasts, the 4.1 billion airline passengers carried in 2017 are expected to grow to about 10.0 billion by 2040, and the number of departures is projected to rise to some 90 million in 2040.
With regard to aircraft, the world’s major manufacturers delivered 1 481 new commercial aircraft in 2017 and recorded 2 131 new aircraft net orders. Book-to-bill ratios for two of the largest aircraft manufacturers increased to around 1.4:1 in 2017 from 1:1 in the previous year, providing an indicator of the increasing pace of aircraft orders. Strong traffic growth projections, low to stable borrowing costs, improving airline profitability, growth of low-cost carriers and the fleet replacement programmes of carriers are expected to maintain the strength of the aircraft market.
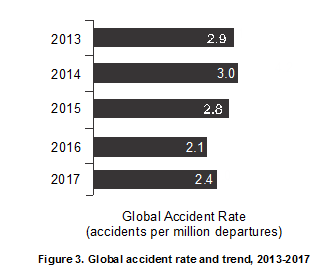
As for aviation safety, there were 88 aircraft accidents for scheduled commercial air transport operations in 2017, an increase of 17 per cent from 2016, when 75 accidents were reported. This is according to an analysis of global accident data involving commercial air transport aircraft with a maximum certificated take-off mass of more than 5 700 kilograms. The number of fatalities in scheduled operations worldwide decreased to 50 fatalities, which represents a substantial decrease from 182 in 2016 and the lowest level on record of the past ten years. The number of fatal accidents decreased from 7 in 2016 to 5, also the lowest in recent records. The global accident rate increased to 2.4 accidents per million schedule departures versus 2.1 accidents per million scheduled departures in 2016.
During 2017, the ICAO Secretariat recorded 21 acts of unlawful interference. These included 1 attack on aircraft in flight, 1 attack using aircraft as a weapon, 1 cyber-attack, 2 unlawful seizures, 9 facility attacks and 7 other attacks. Details concerning all 2017 events are available in the Acts of Unlawful Interference Database, which is accessible through ICAO’s secure website.
