The World of Air Transport in 2015
According ICAO’s preliminary compilation of annual global statistics, the total number of passengers carried on scheduled services rose to 3.5 billion in 2015, which is 6.8 per cent higher than the previous year, while the number of departures reached 34 million in 2015, a 2.6 per cent increase compared to 2014.
Detailed air transport statistics appear in Appendix 1.
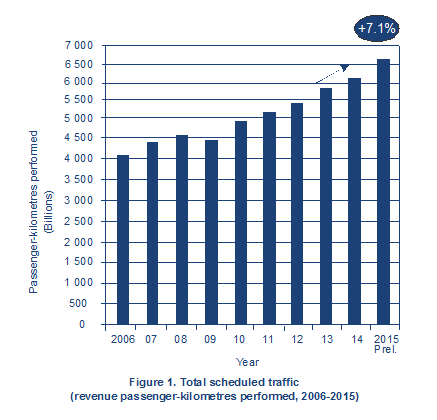
Passenger traffic, expressed in terms of total scheduled revenue passenger-kilometres performed (RPKs), posted an increase of 7.1 per cent, with approximately 6 601 billion RPKs performed in 2015. Asia/Pacific remained the largest region with 32 per cent of world traffic, posting a 9.2 per cent growth in 2015, followed by Europe with 27 per cent of world traffic and a growth of 5.8 per cent. North America, which accounts for 25 per cent of world traffic, grew at 5.1 per cent. The Middle East region, representing 9.0 per cent of world traffic, recorded a growth rate of 10.3 per cent. The Latin America/Caribbean region accounted for 5 per cent of world traffic and grew at 7.8 per cent. The remaining 2 per cent of world traffic was undertaken by African region airlines, who recorded growth of 2.4 per cent.
More comprehensive air transport data are available at:
http://www4.icao.int/newdataplus
International scheduled passenger traffic grew by 7.0 per cent in RPKs in 2015, up from the growth of 6.2 per cent recorded in 2014. The main drivers of this growth were the carriers of China (which saw its international RPKs increase by 31.3 per cent), Turkey (14.6 per cent increase) and the United Arab Emirates (11.9 per cent increase). European air carriers saw growth of 5.6 per cent and accounted for the largest share of international RPKs, at 37 per cent of the total. Asia/Pacific retained the second largest share at 28 per cent. The growth for this region was 8.9 per cent. The Middle East, accounting for 14 per cent of international RPKs, recorded a growth of 10.9 per cent in 2015, overtaking North America as the third largest region. North American and Latin America/Caribbean carriers, which together account for a share of 18 per cent of international RPKs, grew by 3.6 and 10.2 percent, respectively. African carriers, which account for 3.0 per cent of international RPKs, grew by 2.3 per cent. Air carriers of all regions, with the exception of Europe and the Middle East, saw increased growth in 2015 compared to the previous year.
Domestic scheduled passenger traffic grew by 7.3 per cent in RPKs in 2015, up from the 5.6 per cent growth recorded in 2014. The main drivers of this growth were the carriers of the United States, China and India which saw increased growth by 5.9, 10.9 and 20.1 per cent, respectively. North America, the world’s largest domestic market (with a 43 per cent share of domestic RPKs), experienced a strong 5.9 per cent growth in 2015, compared to 3.1 per cent growth seen in 2014. The Asia/Pacific region, with a share of 38 per cent, also grew strongly by 9.6 per cent in 2015 (8.7 per cent in 2014.) Carriers of Europe, accounting for 9.0 per cent of domestic RPKs, saw a growth of 7.0 per cent in 2015, compared to 6.8 per cent in 2014. The Latin America/Caribbean region, which accounts for a 7.0 per cent share, saw growth of 5.5 per cent. Carriers of the Middle East and Africa, which together account for 2.0 per cent of domestic RPKs, saw a contraction of 0.2 per cent and a growth of 2.7 per cent, respectively.
Low-cost carriers carried an estimated 984 million passengers in 2015, which was approximately 28 per cent of the world total scheduled passengers. This indicated a 10 per cent growth when compared to the number of passengers carried by low-cost carriers in 2014, one and a half times the rate of the world total average passenger growth.
The growth of passenger traffic in 2015 fell short of the expectations of the World Bank estimates of global economic growth for 2015 and slowed to 2.4 per cent (from 2.6 per cent in 2014.) In 2015, solid economic conditions in the United States, economic growth in China, India, Japan, Turkey and the High Income Euro Area continued to support passenger demand, offsetting overall economic weakness and slowing growth. The annual average price of jet fuel was 43 per cent lower in 2015 than it was in 2014, giving air carriers significant flexibility to adjust air fares and help stimulate or retain the momentum in passenger traffic growth. In addition, the introduction of new direct routes and additional frequencies between the United States and the United Arab Emirates, China and the United States, and Intra-Asia routes also stimulated additional passenger demand.
Capacity offered by the world’s airlines, expressed as available seat-kilometres, increased globally by 6.2 per cent. While capacity growth ranged from 2.0 per cent in Africa to 12.8 per cent in the Middle East, the average global passenger load factor improved by 0.7 percentage points over 2014, ranging from 68.1 per cent for Africa to 83.7 per cent for North America. The average passenger global load factor reached 80.4 per cent in 2015. Air carriers in all regions except the Middle East were successful in optimizing their available capacity.
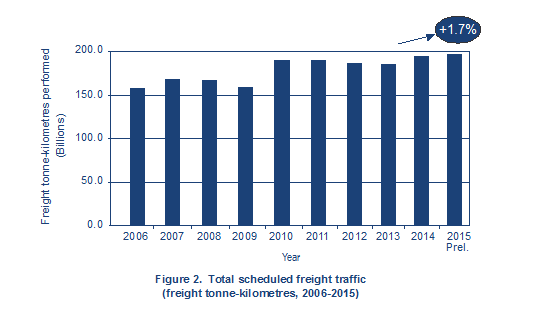
Growth of scheduled total freight traffic, expressed in terms of scheduled total freight tonne-kilometres performed (FTKs), declined sharply to 1.7 per cent in 2015 from 4.7 per cent in 2014 due to slowing global economic growth and an overall decline in trade activity. Approximately 51 million tonnes of freight were carried in 2015. Middle East carriers recorded double digit growth rates of 12.4 per cent while Asia/Pacific increased by 2.3 per cent. Carriers of all other regions saw their growth rates contract compared to the previous year. North America carriers contracted by 2.5 per cent; carriers in Europe, Latin America and the Caribbean, and Africa saw their growth contract by 0.4 per cent, 5.2 per cent and 0.4 per cent, respectively.
Scheduled international FTKs posted an increase of 1.8 per cent in 2015, compared to the 4.9 per cent growth of 2014. International air freight represented around 86 per cent of total scheduled FTKs. Air carriers in Asia/Pacific carried nearly 41 per cent of scheduled international FTKs; the figure was 25 per cent for carriers in Europe, 14 per cent for those in North America, and 16 per cent for the Middle East. This indicated that nearly 80 per cent of long-haul freight traffic flowed on the East-West trade lane that connects Asia to Europe, Asia to North America, and Europe to North America.
Scheduled international freight capacity in 2015, expressed in available freight tonne-kilometres, was approximately 333 billion, a 4.8 per cent growth compared to 2014. The scheduled international freight load factor declined from 52.7 per cent in 2014to 51.2 per cent in 2015 . A combination of slowing demand and competition from other modes of transport were net negatives for air freight in 2015.
In 2015, the operating profit of scheduled airlines of Member States was estimated at about 8.0 per cent of operating revenues. The operating profit was expected to be around USD 57.6 billion in 2015 based on operating revenues of USD 721 billion. Half of the operating profits came from the performance of air carriers in North America. The aforementioned drop in fuel price contributed very significantly to improving profitability for the industry. A detailed variance analysis of changes in operating profits appears in Appendix 1, Table 9.
After a 2.4 per cent growth in real Gross Domestic Product (GDP) in 2015, the World Bank has forecasted the same level of GDP growth for 2016. Accordingly, ICAO has forecasted that total passenger traffic will grow by about 7.3 per cent in 2016. The operating profit for the industry is expected to increase to around USD 65.0 billion in 2016 due to the combined effects of improving economic growth and low and stable jet fuel prices.
According to the latest ICAO long-term air traffic forecasts, the 3.5 billion airline passengers carried in 2015 are expected to grow to about 10.0 billion by 2040, and the number of departures is projected to rise to some 95 million in 2040.
With regard to aircraft, the world’s major manufacturers delivered 1 397 new commercial aircraft in 2015 and recorded 1 948 new aircraft net orders. Book-to-bill ratios for two of the largest aircraft manufacturers declined from around 2:1 in 2014 to around 1.3:1 in 2015. While the declining price of jet fuel could dampen near term demand for new aircraft, traffic growth projections, low borrowing costs, improving airline profitability and the fleet replacement programmes of many carriers are expected to maintain the strength of the aircraft market.
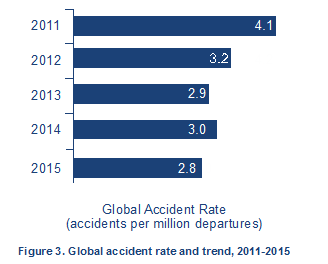
As for aviation safety, there were 92 aircraft accidents for scheduled air services in 2015, a decrease of 5 per cent from 2014, when 97 accidents were reported. This is according to an analysis of global safety data involving commercial air transport aircraft with a maximum certificated take-off mass of more than 5 700 kilograms. The number of fatalities in scheduled operations worldwide decreased to 474 fatalities, from 904 in 2014. The number of fatal accidents further decreased from 7 in 2014 to just 6. The global accident rate decreased to 2.8 accidents per million schedule departures versus 3.0 accidents per million scheduled departures in 2014.
During 2015, the ICAO Secretariat recorded 13 acts of unlawful interference. These included four facility attacks, three attempted sabotages, one successful sabotage, four unlawful seizures of aircraft and one in-flight attack. Details concerning all 2015 events are available in the Acts of Unlawful Interference Database, which is accessible at ICAO’s secure website. More comprehensive safety data are available at
http://www.icao.int/safety/iStars/.
